Minutes from today’s stand up. Feel free to correct/amend.
Sorry for the delay, minutes from Tuesday’s stand up. Feel free to correct/amend.
@RachelLaw, please fix the bits I missed here:
On the ocean carbon side (Rachel), seem to have more of a change ? (iron deposition to blame?).
Minutes from today’s stand up. Feel free to correct/amend.
Hi all,
Following today’s discussion in the CMIP7 meeting, I thought I’d just copy over the current evaluation plots for the Sept A & B runs from the NESP sharepoint (mean state maps, ENSO/IOD properties and teleconnections). There are some plots from the JuneSpinUp run further below as well. I will try to share the evaluation output across both platforms from now on. Assuming this is the right thread to be posting this?
Atmosphere evaluation_17Oct25.pdf (9.0 MB)
Contributions from @zoegillett27 @gab563 @abhik
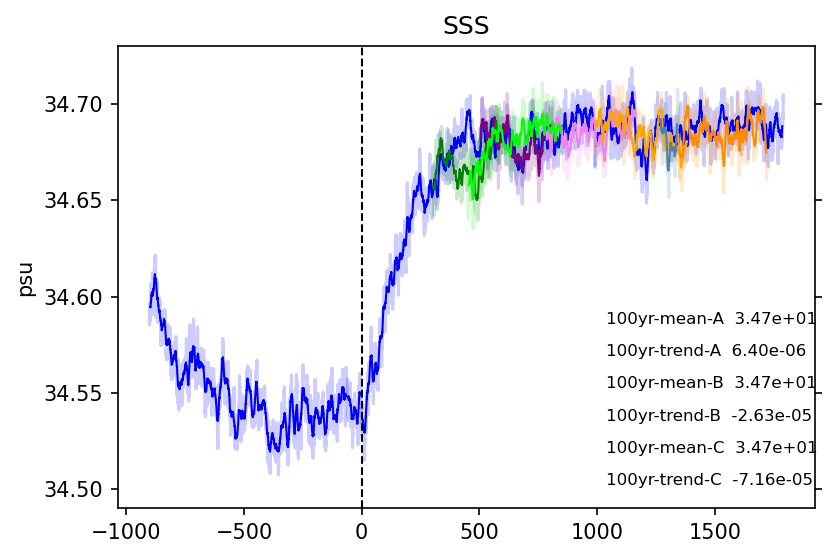
An update on the test spin up runs as of 20/10/2025 - note that the 3 September spin up runs have transitioned to “October Spin ups” (including a bug fix to terrestrial carbon cycle). The 3 test spinup branched off from different years of the previous long (blue) April-June spin up (purple: test A from year 500, orange: B at year 991 and pink: C at year 300). Mean/trend numbers are from the last 50 years of each test simulation; light is annual values, dark a 10 year running mean.

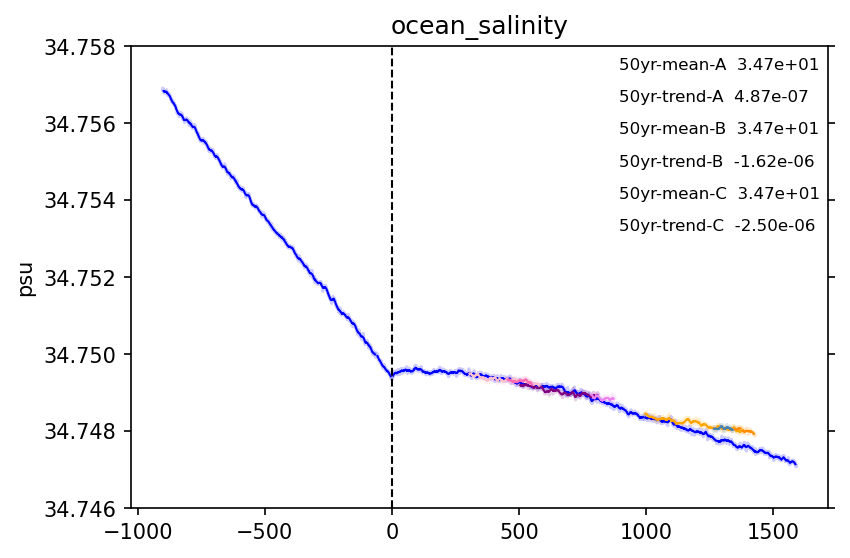
Sea surface temperature and salinity (rapid increase originates in the Mediterranean)


Note there has been a failure of output for test-B at year 030 of the October-B run.
New test runs are sitting around 0.1K in SST (and mean surface air temperature) above the previous spin up and are more stable in full ocean temperature and salinity.
Minutes from today’s stand up. Feel free to correct/amend.
@sofarrell there was a link you were going to add I believe?
Minor update as of 24/10/2025 - there is an indication that the Oct-B run has recently gone through a period of faster cooling. This could be worth assessing in more detail.


As discussed at the standup and break out meetings. Myself, @clairecarouge,@RachelLaw and @anton have come up with a starting skeleton/structure for the ESM1.6 configuration documentation. The temporary url is:
Details of how to edit/contribute are here:
We’ll have a follow up chat with everyone soon as to who would like to coordinate various sections. However, if there’s a section you’re keen to get started on, please make a comment here
The structure at the moment is really just a starting point, we expect it will evolve as we add content.
(Further background on how we arrived at the structure.)
Today’s stand up minutes, please correct / amend.


A small number of global time series from the atmosphere - blue is the previous long spin up (Dec-April-June-August, concatenated), orange is test-B (Sept and Oct phases).


Top of atmosphere energy balance - noting that we suspect the “steady-state” to be non-zero because of how CABLE couples into the diagnostics.

and finally, global metrics for the main land carbon fluxes - note that around year 1280 (dotted line) a bug fix was introduced to the test-B spin up.


1 Like
We might have been worrying too much about the deep ocean and not enough about 1000 m. This is a comparison of the last 100 years of Oct-B, 0101-0200 of the ESM1.5 piControl and World Ocean Atlas. Overall I don’t think 1.6 is worse than 1.5 (though not a very high hurdle in this case)

Extra plots at Global ocean temperature drift · Issue #188 · ACCESS-NRI/access-esm1.6-configs · GitHub.
Hi @MartinDix Thanks for all your plots, I am not entirely surprised that the surface layers may be cooler than ESM1.5, we have had the solar constant cooling change impact and you had a mean SST difference of 0.35 C between the ESM1.5 and OctB run. In OctB the region at 1000m depth is a combination of cooling across Southern Ocean (AAIW, SAMW) being cooler than in ESM1.5 and also in the North Pacific, NPIW will ventilate to these depth will also be slightly cooler. Not sure which century(ies) you did these vertical profiles but the North Atlantic has been oscillating back and forth so both warming and cooling at 1000m depth.
The Antarctic bottom waters have cooled a region below 2000m but the part of the water column that has been affected has increased as we expected it would as the run continued.
I’ve realised during the meeting that since Chris was on leave, he wouldn’t be taking notes.
I’ve put together some notes as best I could. Please edit/amend as necessary.
Latitude-depth plots were wrong (thanks to @manodeep for noticing something suspicious). Corrected version

2 Likes
Here are the meeting minutes today
Please fill in my missing/misunderstanding bits. Particularly given I missed the first five minutes.
Minutes for today’s stand up. Please edit/amend for any corrections
@matthew.chamberlain has just written a topic to enable outputs to calculate meridional ocean tracer transport.
Do we want to put in these changes in our next spinup run? If so, do we want these additional diagnostics to be always output or only for a short time period? I am conscious that more diagnostics will slow down the runs.
If we want to add this in the configuration, who has the time to work on this?
Quite a while ago we changed the ocean layout to 1,1, removing the need for the collation step which caused a lot of the post-processing failures at the time. These variables broke with this change (see here for background) which is why we switched them off.
I think enabling them would require either bringing back the collation, or trying to debug the MOM code. Do we have any preference?