In theory I understand how streamfunctions work, but I’m having trouble migrating from ocean-model-land (where velocities are defined in m/s, and model levels are in m) to UM-atmosphere-model-land (where vertical velocities seem to be defined in Pa/s? maybe? or don’t exist? and vertical co-ordinates can be one of many things)
How would I make a picture like the top half of the image below but using UM output?Specifically, what variables do I need to integrate over what dimensions, and are there any tricky unit conversions I need to consider?
I’m planning on working with ACCESS-CM3 output, but I imagine the broad idea is pretty generalisable.
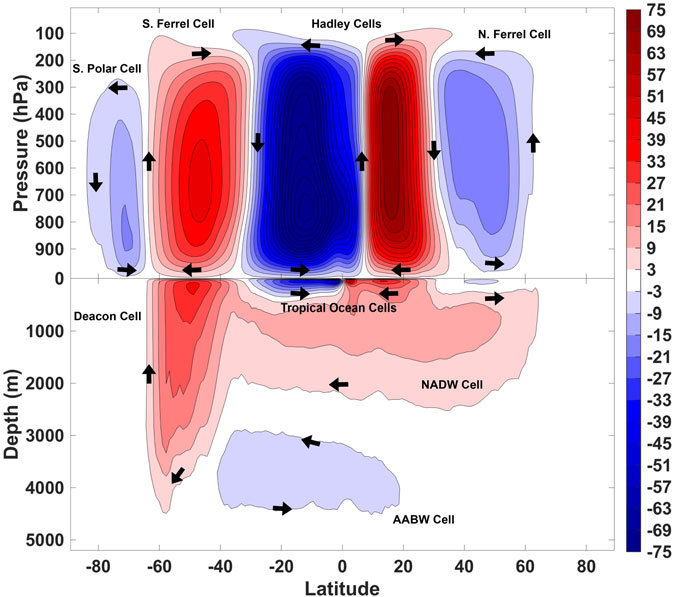
(Dey et al, 2019, The coupled ocean–atmosphere hydrologic cycle)