Glitch in jupyter-lab on ARE xp65

Anyone at ACCESS-NRI want to investigate a cursed problem?

It’s plaguing a lot of people so you’ll get lots of brownie points?

When making big analysis notebooks using xp65 conda and ARE Jupyter Lab the cells start skipping and disappearing, such that analysis can go missing. There’s a whole bunch of reasons why this is bad for science, but it’s also just really annoying.

This happens in many browsers: safari, chrome, firefox, brave. Safari is particularly bad.

I can’t manage to replicate the issue on the default NCI-provided conda environment, so I’m raising this here instead of asking NCI, but if anybody manages to prove that it can’t be fixed within xp65, or encounters the same issue on the NCI default then I’m happy to escalate.

To replicate with xp65 on safari:
Cell 1:

import matplotlib.pyplot as plt

Run this cell.

Cell 2:

plt.plot((0,1))
plt.plot((0,1),0) # Deliberately throwing an error message

Run this cell

Then generate a new cell above Cell 2 by clicking on cell 2 and then the keyboard shortcut “a”. This cell won’t appear immediately, indicative of the glitch. This isn’t the worst of it, but it’s often how the problems start in a larger analysis notebook and it’s easy to replicate.

To replicate with xp65 on Chrome:
Cell 1:

import matplotlib.pyplot as plt
import numpy as np

Cell 2:

x = np.linspace(0,10,20000)
for i in range(10):
    plt.figure()
    plt.plot(x,np.sin(x))
plt.plot(x,np.sin(x[:50]))

Then, repeat the following: randomly scroll up or down a bunch of cells to pick a space somewhere in the middle of the pack, use the keyboard shortcut “a” to produce a new cell IN BETWEEN OTHER EXISTING CELLS, paste the code from Cell 2, and run that cell with shift-enter. I get a glitch in scrolling in under 10 repetitions of this process. If you just make new cells at the start or end of the notebook, it doesn’t seem to cause the issue; only if you make cells randomly in the middle of the notebook. (if my instructions don’t make sense here, happy to zoom or walk over to NRI and explain the process)

I’m sorry that this is not the most minimal of MVWEs, but I’ve had trouble trimming it down. e.g. I can’t manage to glitch with repeated straight lines between two points, but the same figure size with a hyper-detailed sine wave does break it

I am not implying that matplotlib or numpy are responsible for the glitch. I think that the error message + plot output is helpful in generating the glitch, but that might just be because it’s an efficient way of generating lots of cell output.

I think it’s the same issue as here and here, though these are the only references I can find on the internet, which suggests some kind of really niche work flow in use by lots of the ANU oceans/climate people.

This problem has been encountered by the following people, and it’s driving many of us nuts. (If you want me to add you to the list DM me or like the post rather than replying below, or we’re going to end up with an enormous thread of too many people saying “I have that problem too”)

@jemmajeffree, @JuliaN, @ellepola, @polinash, @KZCurtin, @Luwei, @wghuneke, @aekiss, @navidcy, @taimoorsohail, @mmr0, @claireyung,

Any help would be appreciated. I managed to fix the problem on my local computer a year or so ago by pinning an old version of jupyter notebook? The fact that I can’t replicate this on gadi without the xp65 conda environment suggests that it’s some kind of jupyter version thing (though, admittedly, I haven’t messed around with lots of baby environments seeing what’s specifically needed to replicate the problem on gadi)

9 Likes

This random disappearing of jupyter notebook cells has been a point of struggle for me for long.

I was always thinking “it’s me, not them”.

I’ve experienced it in various browsers and also before xp65. Also not necessarily using ARE sessions…

I’d be wholeheartedly grateful to anybody that can help diminish this if possible.

1 Like

Do these look like the same issue you are experiencing?

If so, it looks like the issue remains unresolved, but there’s a suggestion that downgrading to notebook=7.3.0 and jupyterlab=4.3.0 might fix the issue. If we can confirm this, we could consider rolling these back (@rbeucher, @CharlesTurner?). Note, the versions used on the ARE by default (i.e. not using the xp65 conda envs) are notebook=6.4.12 and jupyterlab=3.4.3.

1 Like

Yep, I think it’s the same problem. I’d expect that downgrading notebook and jupyterlab would fix the problem, though I have to admit I’m confused if there’s a known major issue that doesn’t occur in a previous version and the update had more cost than gain?

Ok, so it looks like analysis3 uses notebook==7.4.5 and jupyterlab==4.4.6.

Neither of those are a major version out from the suggested fix, so I’ll try rebuilding the environment with those and see what happens. I’ll also check if we can solve the environment with the default ARE versions to see if that ameliorates the issue - Jemma’s post indicates to me it might - but I’m less confident we’ll be able to do that.


Background on the issue

This is almost certainly not a python issue, and is probably a javascript issue instead. For anyone who’s ever wondered why you get weird git diffs like this when you look at notebooks:

index 408101d..0ca38d5 100644
--- a/Untitled-1.ipynb
+++ b/Untitled-1.ipynb
@@ -2,7 +2,7 @@
  "cells": [
   {
    "cell_type": "code",
-   "execution_count": 1,
+   "execution_count": 2,
    "id": "25423f80",
    "metadata": {},
    "outputs": [
@@ -24,7 +24,7 @@
        "       86, 87, 88, 89, 90, 91, 92, 93, 94, 95, 96, 97, 98, 99])"
       ]
      },
-     "execution_count": 1,
+     "execution_count": 2,
      "metadata": {},
      "output_type": "execute_result"
     }
@@ -39,6 +39,38 @@
     "\n",
     "np.arange(1,100)"
    ]
+  },
+  {
+   "cell_type": "code",
+   "execution_count": 3,
+   "id": "2de0c1bf",
+   "metadata": {},
+   "outputs": [
+    {
+     "data": {
+      "text/plain": [
+       "[<matplotlib.lines.Line2D at 0x1485012e0>]"
+      ]
+     },
+     "execution_count": 3,
+     "metadata": {},
+     "output_type": "execute_result"
+    },
+    {
+     "data": {
+      "image/png": "iVBORw0KGgoAAA..nP8PLQdhZMGa0AAAAAAASUVORK5CYII=",
+      "text/plain": [
+       "<Figure size 640x480 with 1 Axes>"
+      ]
+     },
+     "metadata": {},
+     "output_type": "display_data"
+    }
+   ],
+   "source": [
+    "import matplotlib.pyplot as plt\n",
+    "plt.plot(np.arange(1,100))"
+   ]
   }
  ],
  "metadata": {

It’s because a jupyter notebook is actually a .json file in a trenchcoat. json (Javascript object notation) is what a server and a Single Page Application (SPA, think anything built in react, ie. Facebook, Instagram, Xero, etc etc) use to communicate. It’s also how anything built using Electron (ie. VS Code, Teams, Balena Etcher) works. The Jupyter frontend apparently uses react with some custom extra bits - I’ll come back to that.

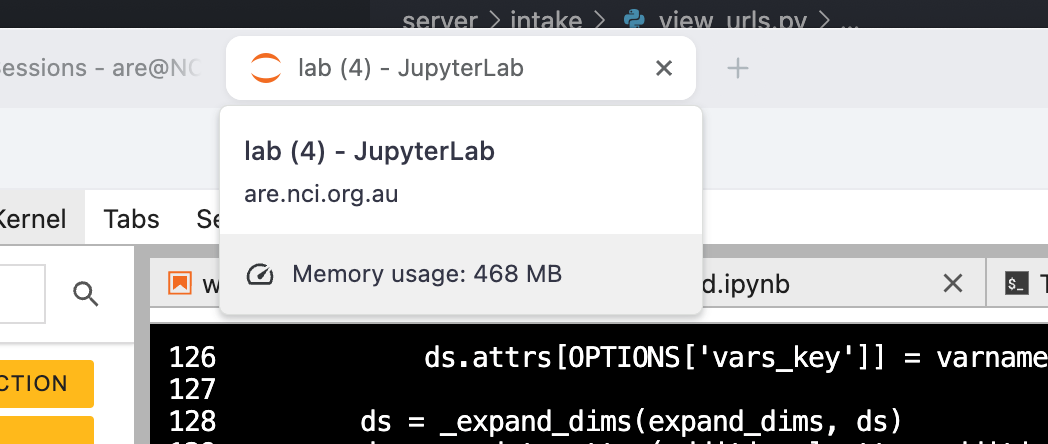
Basically, when you have an interactive web application (ie. a jupyter notebook), and a running server - jupyterlab does this - here is an excerpt from an ARE session PBS log:

[I 2025-09-30 15:30:49.162 ServerApp] Serving notebooks from local directory: /home/189/ct1163/.jupyter-root
[I 2025-09-30 15:30:49.162 ServerApp] Jupyter Server 2.16.0 is running at:
[I 2025-09-30 15:30:49.162 ServerApp] http://localhost:42996/node/gadi-cpu-bdw-0019.gadi.nci.org.au/42996/lab
[I 2025-09-30 15:30:49.162 ServerApp]     http://127.0.0.1:42996/node/gadi-cpu-bdw-0019.gadi.nci.org.au/42996/lab
[I 2025-09-30 15:30:49.162 ServerApp] Use Control-C to stop this server and shut down all kernels (twice to skip confirmation).
[W 2025-09-30 15:30:49.170 ServerApp] No web browser found: Error('could not locate runnable browser').
Discovered Jupyter Notebook server listening on port 42996!

they will communicate by sending blobs of json back and forth.

So where does it all go wrong?

TLDR; Javascript is a (glorious) mess, and it’s very easy to shoot yourself in the foot with it. I don’t know exactly why or where the issue is coming from, but because of the necessarily asynchronous way that web apps are designed, it’s very easy to cause subtle bugs with race conditions, etc, which lead to issues like these.

Race conditions are almost certainly the source of the problems here - when you send a really large output - think a massive plot, output ten million lines of warnings, or just print a gigantic xarray dataarray, the jupyterlab server has to send all that data as a json blob back to the client (web browser javascript engine). This takes a while. A few years ago, I tried to send an entire pandas dataframe (~100k rows) as a json blob, and it took about a minute, from a server running locally on my machine to the browser on my machine.

Why is this a problem? Because in the meantime, whilst your json blobs are sent over the wire, you can send other instructions to the browser. Remember how I said jupyter uses react? React uses a thing called a Virtual DOM (Document Object Model - it’s basically a javascript object that represents the web page you have open), and that does it’s best not to render everything at once. When stuff scrolls out of view, react unmounts it. If stuff is still being sent over the wire at this point & the author of the jupyterlab code handling this wasn’t very careful, all manner of weird bugs can occur.

N.B: The client and server will be firing JSON back and forth continuously - not just when you execute a bit of code. You can create your own footguns, but the browser has plenty of it’s own.


With all that in mind, some things you can do to hopefully reduce the issue, whilst we see if we can find a version of jupterlab without this particular bug:

  1. Don’t keep too much output hanging around, if possible. Notebooks that look like this
/var/folders/qg/vhg6q9gn4zl01xbg1mfw6jzhxzf1wt/T/ipykernel_10498/1352830306.py:5: UserWarning: This is a warning
  warnings.warn("This is a warning")
/var/folders/qg/vhg6q9gn4zl01xbg1mfw6jzhxzf1wt/T/ipykernel_10498/1352830306.py:5: UserWarning: This is a warning
  warnings.warn("This is a warning")
/var/folders/qg/vhg6q9gn4zl01xbg1mfw6jzhxzf1wt/T/ipykernel_10498/1352830306.py:5: UserWarning: This is a warning
  warnings.warn("This is a warning")
/var/folders/qg/vhg6q9gn4zl01xbg1mfw6jzhxzf1wt/T/ipykernel_10498/1352830306.py:5: UserWarning: This is a warning
  warnings.warn("This is a warning")
/var/folders/qg/vhg6q9gn4zl01xbg1mfw6jzhxzf1wt/T/ipykernel_10498/1352830306.py:5: UserWarning: This is a warning
  warnings.warn("This is a warning")
/var/folders/qg/vhg6q9gn4zl01xbg1mfw6jzhxzf1wt/T/ipykernel_10498/1352830306.py:5: UserWarning: This is a warning
  warnings.warn("This is a warning")
/var/folders/qg/vhg6q9gn4zl01xbg1mfw6jzhxzf1wt/T/ipykernel_10498/1352830306.py:5: UserWarning: This is a warning
  warnings.warn("This is a warning")
/var/folders/qg/vhg6q9gn4zl01xbg1mfw6jzhxzf1wt/T/ipykernel_10498/1352830306.py:5: UserWarning: This is a warning
  warnings.warn("This is a warning")
/var/folders/qg/vhg6q9gn4zl01xbg1mfw6jzhxzf1wt/T/ipykernel_10498/1352830306.py:5: UserWarning: This is a warning
  warnings.warn("This is a warning")
/var/folders/qg/vhg6q9gn4zl01xbg1mfw6jzhxzf1wt/T/ipykernel_10498/1352830306.py:5: UserWarning: This is a warning
  warnings.warn("This is a warning")
/var/folders/qg/vhg6q9gn4zl01xbg1mfw6jzhxzf1wt/T/ipykernel_10498/1352830306.py:5: UserWarning: This is a warning
  warnings.warn("This is a warning")
/var/folders/qg/vhg6q9gn4zl01xbg1mfw6jzhxzf1wt/T/ipykernel_10498/1352830306.py:5: UserWarning: This is a warning
  warnings.warn("This is a warning")
/var/folders/qg/vhg6q9gn4zl01xbg1mfw6jzhxzf1wt/T/ipykernel_10498/1352830306.py:5: UserWarning: This is a warning
  warnings.warn("This is a warning")
/var/folders/qg/vhg6q9gn4zl01xbg1mfw6jzhxzf1wt/T/ipykernel_10498/1352830306.py:5: UserWarning: This is a warning
  warnings.warn("This is a warning")
/var/folders/qg/vhg6q9gn4zl01xbg1mfw6jzhxzf1wt/T/ipykernel_10498/1352830306.py:5: UserWarning: This is a warning
  warnings.warn("This is a warning")
/var/folders/qg/vhg6q9gn4zl01xbg1mfw6jzhxzf1wt/T/ipykernel_10498/1352830306.py:5: UserWarning: This is a warning
  warnings.warn("This is a warning")
/var/folders/qg/vhg6q9gn4zl01xbg1mfw6jzhxzf1wt/T/ipykernel_10498/1352830306.py:5: UserWarning: This is a warning
  warnings.warn("This is a warning")
/var/folders/qg/vhg6q9gn4zl01xbg1mfw6jzhxzf1wt/T/ipykernel_10498/1352830306.py:5: UserWarning: This is a warning
  warnings.warn("This is a warning")
/var/folders/qg/vhg6q9gn4zl01xbg1mfw6jzhxzf1wt/T/ipykernel_10498/1352830306.py:5: UserWarning: This is a warning
  warnings.warn("This is a warning")
/var/folders/qg/vhg6q9gn4zl01xbg1mfw6jzhxzf1wt/T/ipykernel_10498/1352830306.py:5: UserWarning: This is a warning
  warnings.warn("This is a warning")
/var/folders/qg/vhg6q9gn4zl01xbg1mfw6jzhxzf1wt/T/ipykernel_10498/1352830306.py:5: UserWarning: This is a warning

are going to be particularly prone to it. Clearing the duplicated warnings is probably going to improve the situation, at least a bit.
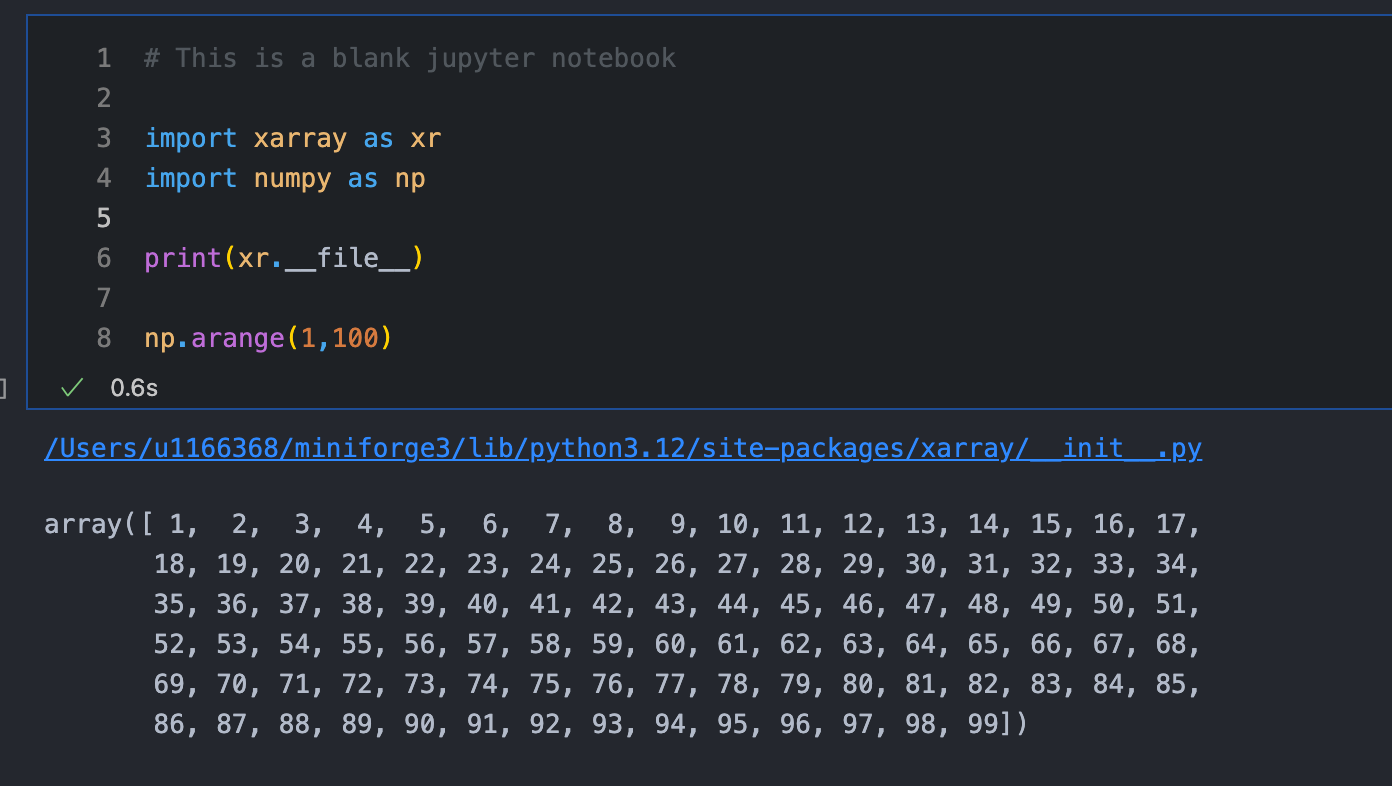
2. Don’t print out massive arrays constantly in order to look at them. Stuff like this:


is likely also going to cause issues. Unassigned statements at the end of code cells in order to view the outputs should be cleaned up when you’re done looking at them - ie. change it to this:

Really, it boils down to being mindful of the amount of data that you’re sending back and forth. If it gets too big, the issue is likely to occur - especially if you start triggering lots of other browser events.

Anyhoo, I’ll see if we can update those package versions & whether that helps at all.

7 Likes

I think there is a case for pinning the version in analysis3 to the default ARE version. I usually don’t like downgrading and @jemmajeffree point is true too. I am freezing analysis3-25.09 and moving to analysis3-25.10 today. I will downgrade in 25.10 and we can see how it goes.

1 Like

Thanks Charles for the detailed breakdown.

If I’m understanding correctly, does that mean that a workflow where you save plots instead of showing them inline would almost entirely stop the glitches?

Thanks also to those looking into pinning a version to mitigate the problem, hopefully we can sort something better out

I can’t say for sure that saving the plots instead of showing them would stop the glitches, but it’ll probably help. Unfortunately, it also completely defeats the point of using a notebook (in my opinion)…

One thing to do would be to monitor the size of the notebook as you go, especially if you start getting glitches:

!du -h Untitled.ipynb
 24K	Untitled.ipynb

Trying to get a feel for what kind of data might be clogging everything up is probably a good start. If you get a glitch, then testing notebook size, clearing cell outputs and testing again should begin to give you some sort of indication which outputs are problematic.

Unfortunately, these solutions all kind of suck. It’s just an unfortunate limitation of the technology, really.

1 Like

Thanks for that detailed rundown Charles.

I’m glad I’m not the only one to suffer this!

1 Like

For conda reasons, we can’t try out the exact versions Dougie suggested

The closest we can get is

  • notebook==7.3.0
  • jupyterlab==4.3.2

Fingers crossed that’ll help.

I won’t deploy the changes today - if it goes haywire (the most likely bad outcome would be making the glitches worse, not better) it’ll bork the analysis3 environment for anyone who might want to use it over the weekend - but I think we should be able to apply them early next week.

We’ll then be reliant on people piping up & letting us know whether their experience of the ARE notebook glitching is better/the same/worse!

I’ll update this thread once the versions are changed.

2 Likes

This is a temporary solution that worked for me: JupyterLab Version 4.2.1 barely useable due to a variety of glitches - #5 by jbusecke - JupyterLab - Jupyter Community Forum

2 Likes

That looks like it should work pretty well to me, great find!

One thing to be aware of with setting windowing to None is that it seems to disable any react virtualisation logic - this can cause your browser tab to consume heaps of memory, especially with large notebooks - again, lots of warnings, printouts of large arrays, etc.

With all that said, it’s infinitely preferable to the glitches. But if you are running large notebooks on a cheap/old laptop, its one to watch out for!

1 Like

I only just saw this. The only routine issue I see occurs both at NCI and on jupyter notebooks in general. The issue is skipping of cell outputs when scrolling, not skipping execution. As such I’m not sure it’s the same issue. The only reliable “fix” is to resize the output window by dragging it until it triggers a GUI resize. Then everything works again until the next time I execute some cells. I don’t use xp65 but I’d be happy to join the project, fire up a known problematic notebook, and see if my workaround addresses the issue. If it does, I’m pretty sure there’s no “fix” available, just workarounds.

Only semi-related, but has anyone explored marimo.io notebooks for use in ARE? My (limited) investigations are that the GUI is more reliable, but it’s not going to be preferred by everyone. I liked it, but also ended up abandoning it because of my particular requirements, but I can see it meeting some people’s needs.

I’ve updated the versions of jupyterlab and notebook in conda/analysis3.

If everyone experiencing the issue notices any changes (improvements/regressions/nothing much) please let me know.

In the meantime, if it doesn’t fix it, the other workarounds suggested should help with the issue.

Marimo notebooks look very interesting & I’ve been meaning to look into them properly for a while. Have you tried using them in ARE Tennessee?

Still happening in both Safari and Chrome with the same steps-to-break I described above, in both analysis3 and analysis3-25.10

Separately:

Of comparable magnitude to keeping a 16GB array in memory or working with all the memory of a 128GB node? Or are we talking local memory?

1 Like

Yeah, local memory.

If you were to print out the entirety of a ridiculously big array, ie.


my_comically_enormous_array = np.arange(...)

# Bottom of the cell

my_comically_enormous_array

and got an output something like this - except without the ellipsis.

np.array[1.0, 2.0... (I haven't typed this out for obvious reasons)... 1e400]

then all those numbers would have to exist in the html source for your page - which is open on your laptop, not Gadi. The windowing setup on Jupyterlab is designed to stop this ever becoming a problem. If your ARE session has more memory available than your laptop (likely, given that’s the whole point of using an HPC), then this can cause issues when you disable windowing - but it’s pretty unlikely in all honesty.

I use brave and I can monitory the memory usage of a tab by mousing over it:


That’s frustrating it doesn’t work. Does Doug’s suggestion help at all?

I don’t have the knowhow to set up Marimo for use in ARE. I tried them out on my own dev environment on a personal project. If it is possible to set up, it would be interesting to experiment with, I’d be happy to put some examples together.

Looks like marimo can be run from ARE using ‘jupyter-marimo-proxy’, e.g. create a conda environment with

channels:
  - conda-forge
  - nodefaults
dependencies:
  - marimo
  - jupyter-marimo-proxy
  - jupyterlab

You also need the variable JUPYTERHUB_SERVICE_PREFIX to be set before jupyter starts using

JUPYTERHUB_SERVICE_PREFIX="$(sed -n "$CONFIG_FILE" -e "s/.*base_url = '\(.*\)'/\1/p")"
export JUPYTERHUB_SERVICE_PREFIX

I’ve done this with a wrapper script that launches the real jupyter. Happy to share the container with you if you want to try playing with it.